


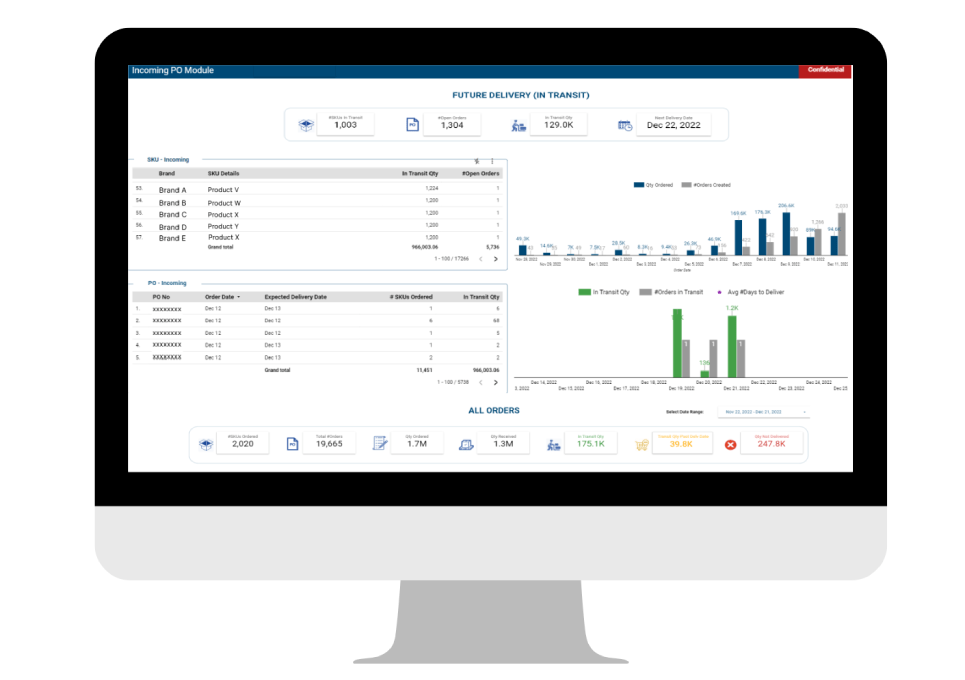
Order & Supplier
Management
A set of dashboards to manage orders and suppliers - This helps to provide understanding of order cycles for every product with trends tracked over time, represented graphically for efficient monitoring. Operators can see at a glance the volume and frequency of orders, the lead time for delivery and any changes in trend. This allows for prompt alert and better coordination to support forward planning and forecasting needs.
Inventory & Stocks
Visibility
Gain insights into stock availability summarised using data visualisation capabilities. Built-in multi-tier product classification filters allow for quick product search for every level of analysis needs. In a single view, see current inventory health, past inventory positions, throughput volume and trend and include safety stock level lines for monitoring and alerts. Identify slow moving products by monitoring their time in the warehouse and be alerted of those that require attention. This set of dashboards helps with inventory planning to prevent out-of-stock and inventory aging.
Order Fulfilment & Ops
Performance
Deep dive into order fulfilment insights to understand drop-offs and root cause diagnostics, from upstream, midstream to downstream. Key supply chain performance metrics such as delivery on time, delivery in full, perfect order score and drop-off rates, automated to support operations planning and pinpointing potential optimisation areas. This provides a single platform to monitor and take action on underlying fulfilment issues and the value impact due to performance lapse.


Stay competitive...
Optimising your supply chain ...

Collaborate ....
Let's have a chat to see how we can work together to improve our supply chain.
Stay competitive
Optimising your supply chain
Collaborate
Let's have a chat to see how we can work together to improve our supply chain.
A Closer Look at FairPrice Group's FFDC: Elevating Cold Chain Standards
Learn More

Revealing Automated Sorting and Distribution Function in Warehouse Automation
Learn More

Improving Efficiency through Logistics Services in Singapore's Fast-Moving Consumer Goods (FMCG) and Fresh Food Sectors
Learn More
Leveraging Business Intelligence Tools for Competitive Advantage in Retail
Learn More

Improving Supply Chain Visibility with Intelligence Logistics
Learn More

5 Reasons for Retailers to Deploy Inventory Tracking Systems
Learn More

Best Practices in Implementing Just-in-Time (JIT) Delivery for Distribution Services in Fast-Moving Consumer Good (FMCG) Sector
Learn More

3 Key Strategies for Ecommerce Fulfilment to Handle High Demand
Learn More

How FPGSC's customers Benefit from Effective Warehousing and Logistics Solutions?
Learn More
FPGSC Leverages the Key Roles of Integrated Warehousing and Logistics Solutions to Streamline Core Processes and Optimise Supply Chain Performance
Learn More

Impact of Delivery OTIF on Customer Satisfaction and Retention
Learn More

Develop, Deploy, Scale- Leveraging the Power of Data Analytics in the National Fight Against COVID-19
Learn More

The Importance of 3PL in Supply Chain Management
Learn More

Building resilience for a nation – Farewell to our CEO Mr Ngien Hoon Ping
Learn More
How working in supply chain has become attractive again
Learn More
How FPGSC visualises end-to-end supply chain (5PL) and how the team makes it happen
Learn More

Why Strong Supplier Relations Matter to FairPrice
Learn More

Harnessing the Best of Data for Supply Resilience
Learn More